Analysis
Trend and delay
Loading updates, the trend, baseline comparison and windows analysis.
Load two or more updates of the same programme and the app compares them: where the finish is heading, what moved it, and whether the dates are coming true.
Loading updates#
Open Trend & Forecast, Baseline & Delay or Forensic Analysis and add files to the session. Load them in any order: they're sorted by data date. A baseline and a progress update are the same thing to the app, snapshots of one project at different data dates.
Trend and forecast#
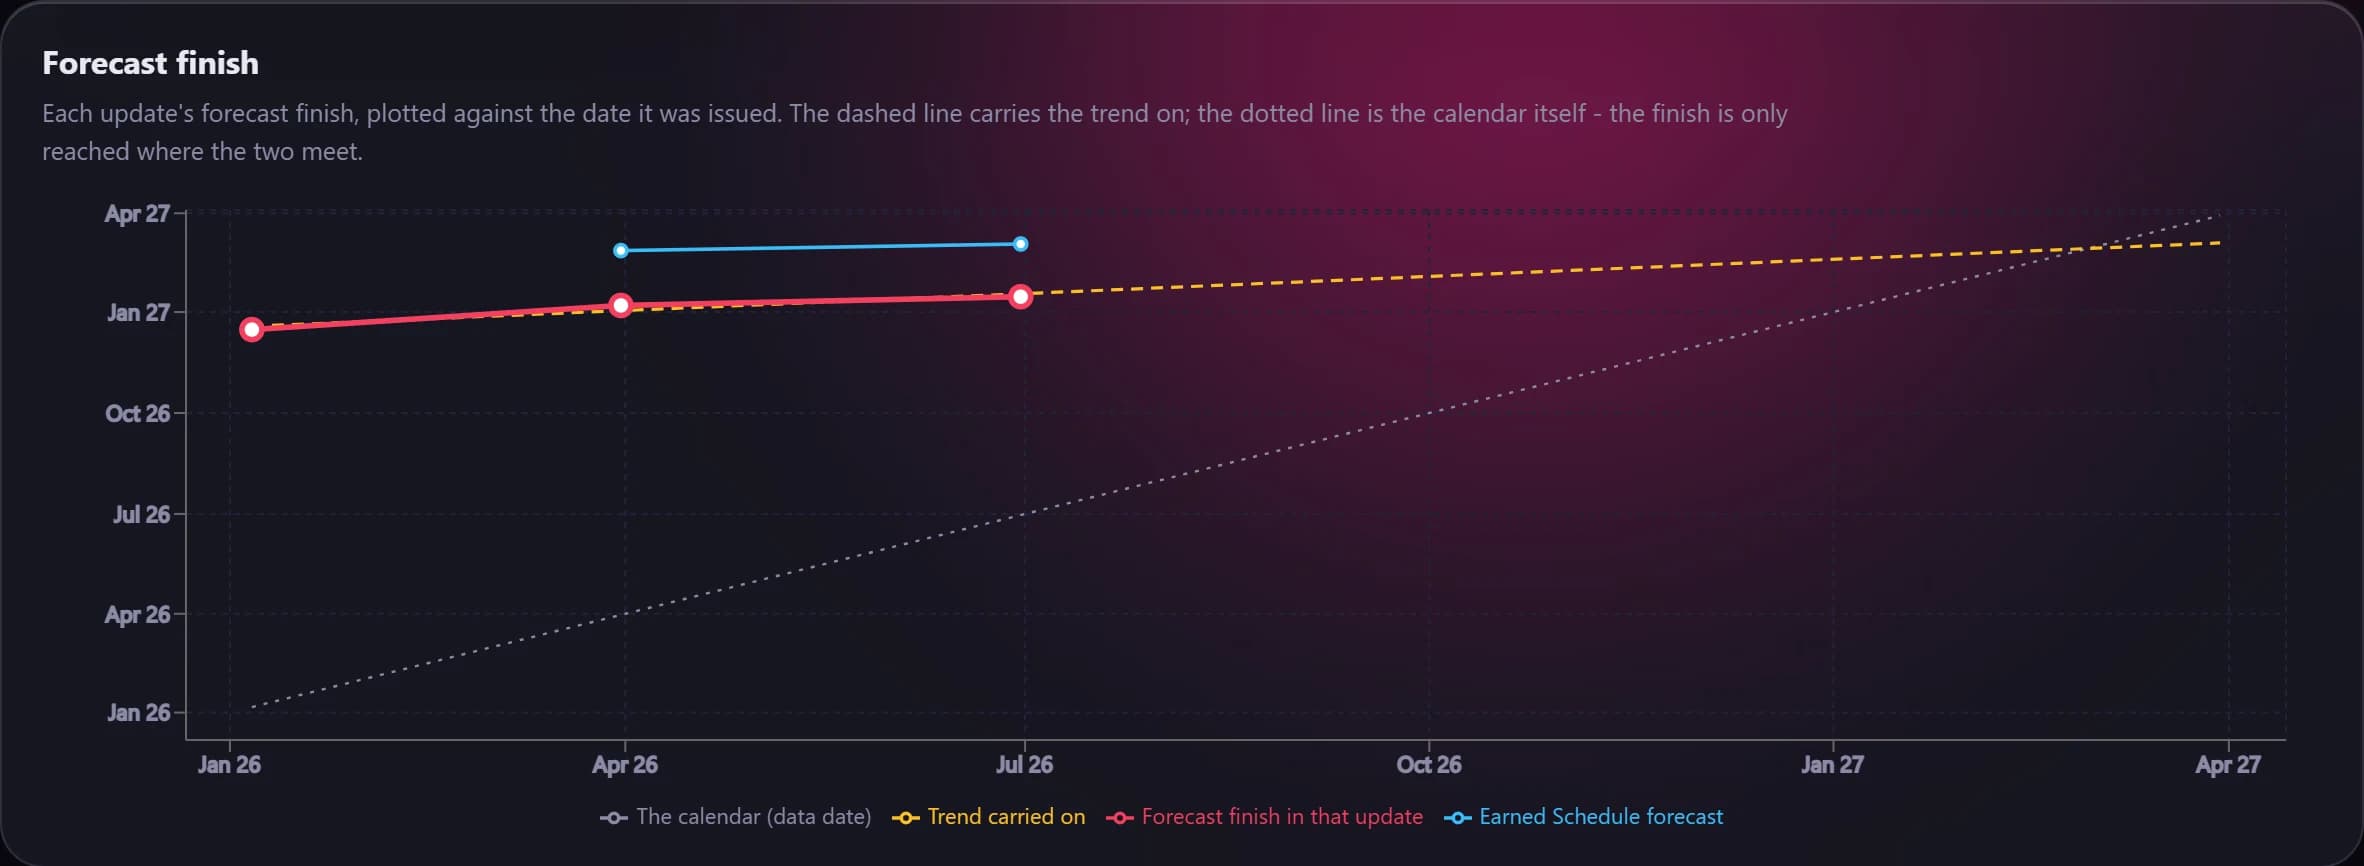
- Where the finish is heading: each update's scheduled finish, the slip between updates, the slippage rate (days slipped per day elapsed) with a plain-English verdict, where the finish lands if the trend carries on, and a run-rate forecast from the rate work has actually been done.
- Progress against its own plan: duration-weighted percent complete, compared each period with what the earlier update expected done by the later data date.
- Whether its dates come true: of the work an update said would start or finish before the next data date, how much did (the hit rate), and a list of the finishes that were missed.
- Re-planning: activities added and removed; logic, lag, duration and constraint changes; and completed work that lost its actual dates.
- Milestone trend: every milestone's forecast in each update, charted and tabled with its slip.
- SPI, CPI and SPI(t) over time, only where the updates are cost- or resource-loaded.
Baseline and delay#
Compare any two files, by default the earliest data date against the latest:
- Finish moved: each file's own forecast finish, in working days and calendar days.
- Slip: how much of the work still open at the baseline slipped or came in ahead, the median and worst slip, milestones slipped, and activities that became or stopped being critical.
- Scope: activities added and removed.
- Unstatused work: open work a file still showed before its own data date is measured at that data date and tagged not statused, rather than read as months of delay.
Work already complete at the baseline is left out of the slip figures, where it would only pull every figure towards zero.
Windows analysis#
Every loaded file, in data-date order, and each consecutive pair compared: how far the finish moved in that window and which work moved it. Each activity's movement is split into what it inherited, the most any predecessor moved, and its own delay. Own delay on work that was critical when the window opened is listed as where that window's delay started.
Workbooks#
The trend workbook has the summary, updates, periods, milestones and missed finishes. The baseline and delay workbook has every activity's variance with a colour scale, milestones, scope added and removed, windows and delay contributors.