Analysis
Schedule risk (QSRA)
Setting up and reading a Monte Carlo schedule risk analysis.
The Risk Analysis tab runs a Monte Carlo simulation over the remaining work, a quantitative schedule risk analysis (QSRA). It's included in Team and Enterprise plans.
What it models#
Duration uncertainty. Every remaining activity gets a three-point range: optimistic and pessimistic, as a percentage of its duration. A default applies to everything; rules override it for a WBS branch, an activity-code value or a single activity. The first matching rule wins, and you can reorder them.
Risk events. A register of things that may or may not happen. Each has a probability; a minimum, most likely and maximum impact in working days; the activities it would delay; and, optionally, post-mitigation values. Import and export it as CSV.
Running it#
Set the ranges
Start with the default range, then add rules where you know better: a weather-exposed section, a long-lead supplier.
Build the register
Add the risks that would delay specific work. Link each to the activities it would hit. Add mitigated values where there's a real mitigation.
Choose the settings
Iterations (2,000 by default, fewer on very large networks, where percentiles stabilise sooner), triangular or BetaPERT distribution, and a target date.
Run the simulation
The last run is saved with the session and reopens with the tab. It's also included in the Excel export.
Reading the results#
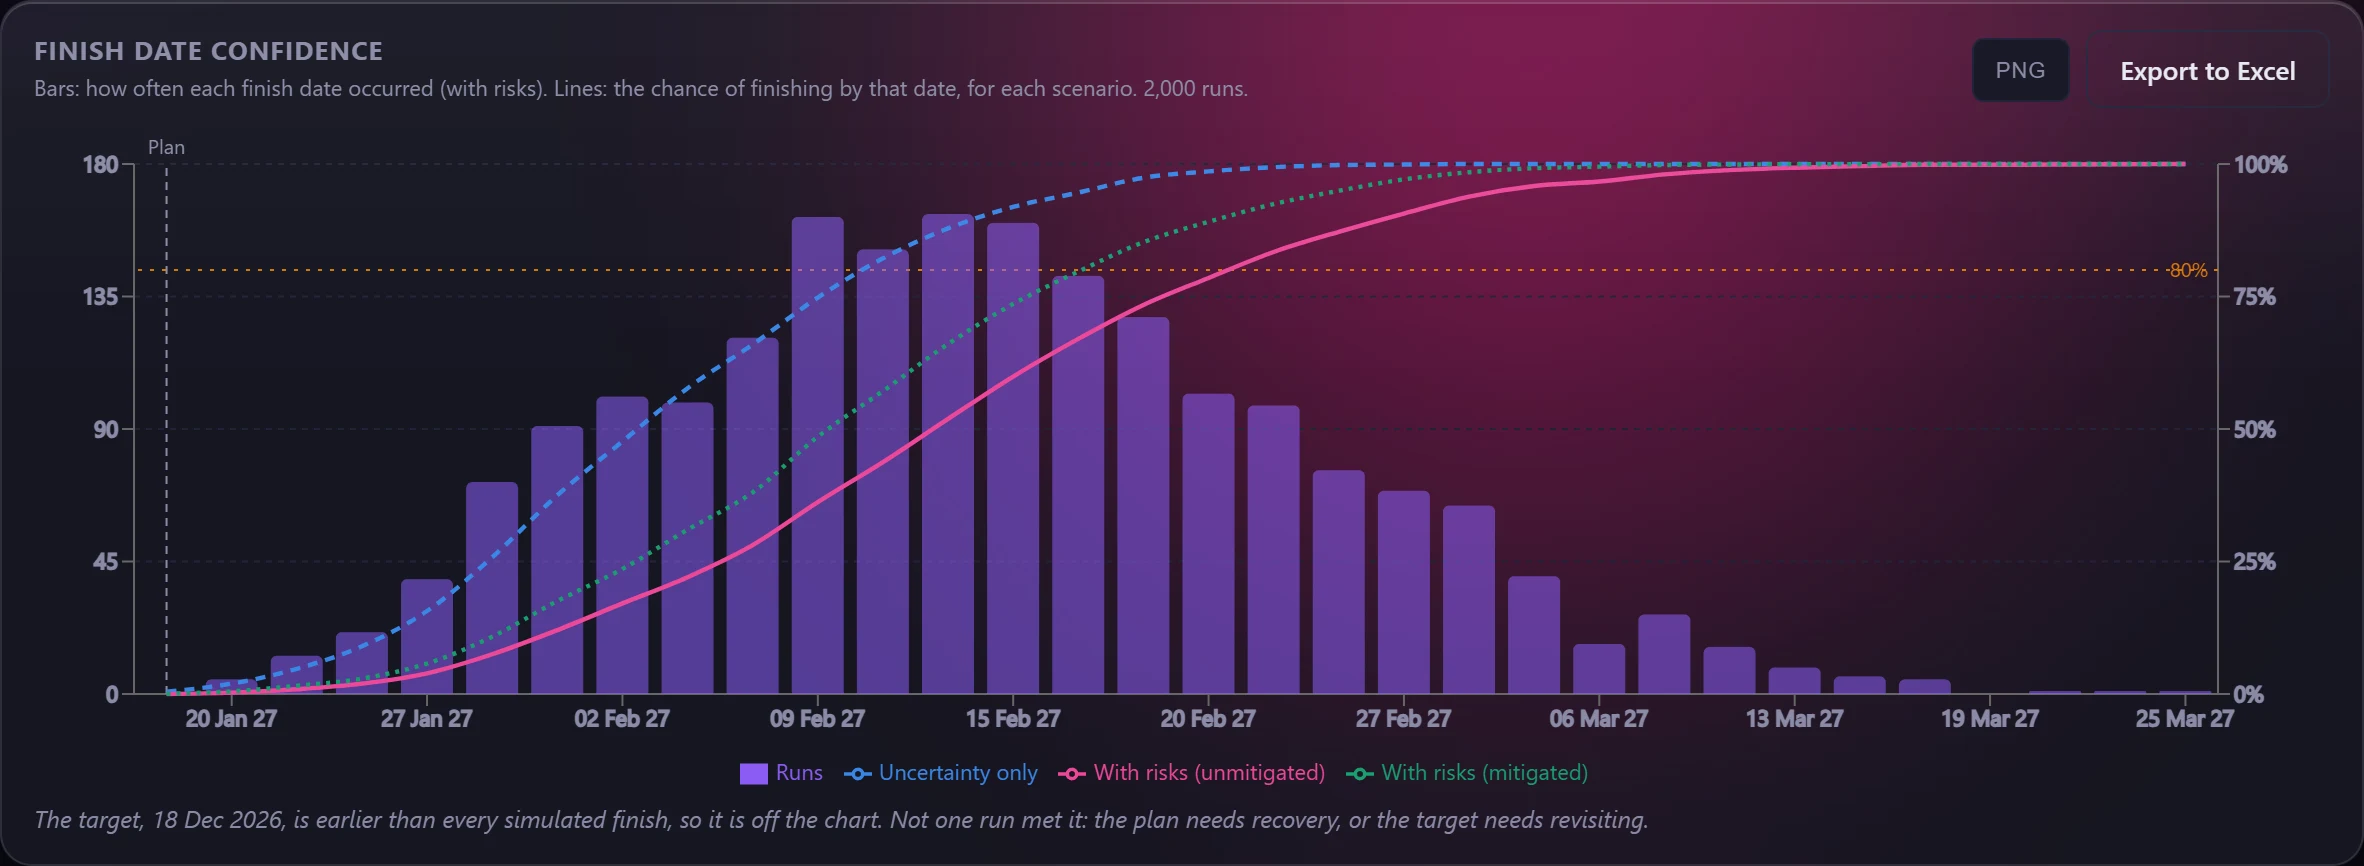
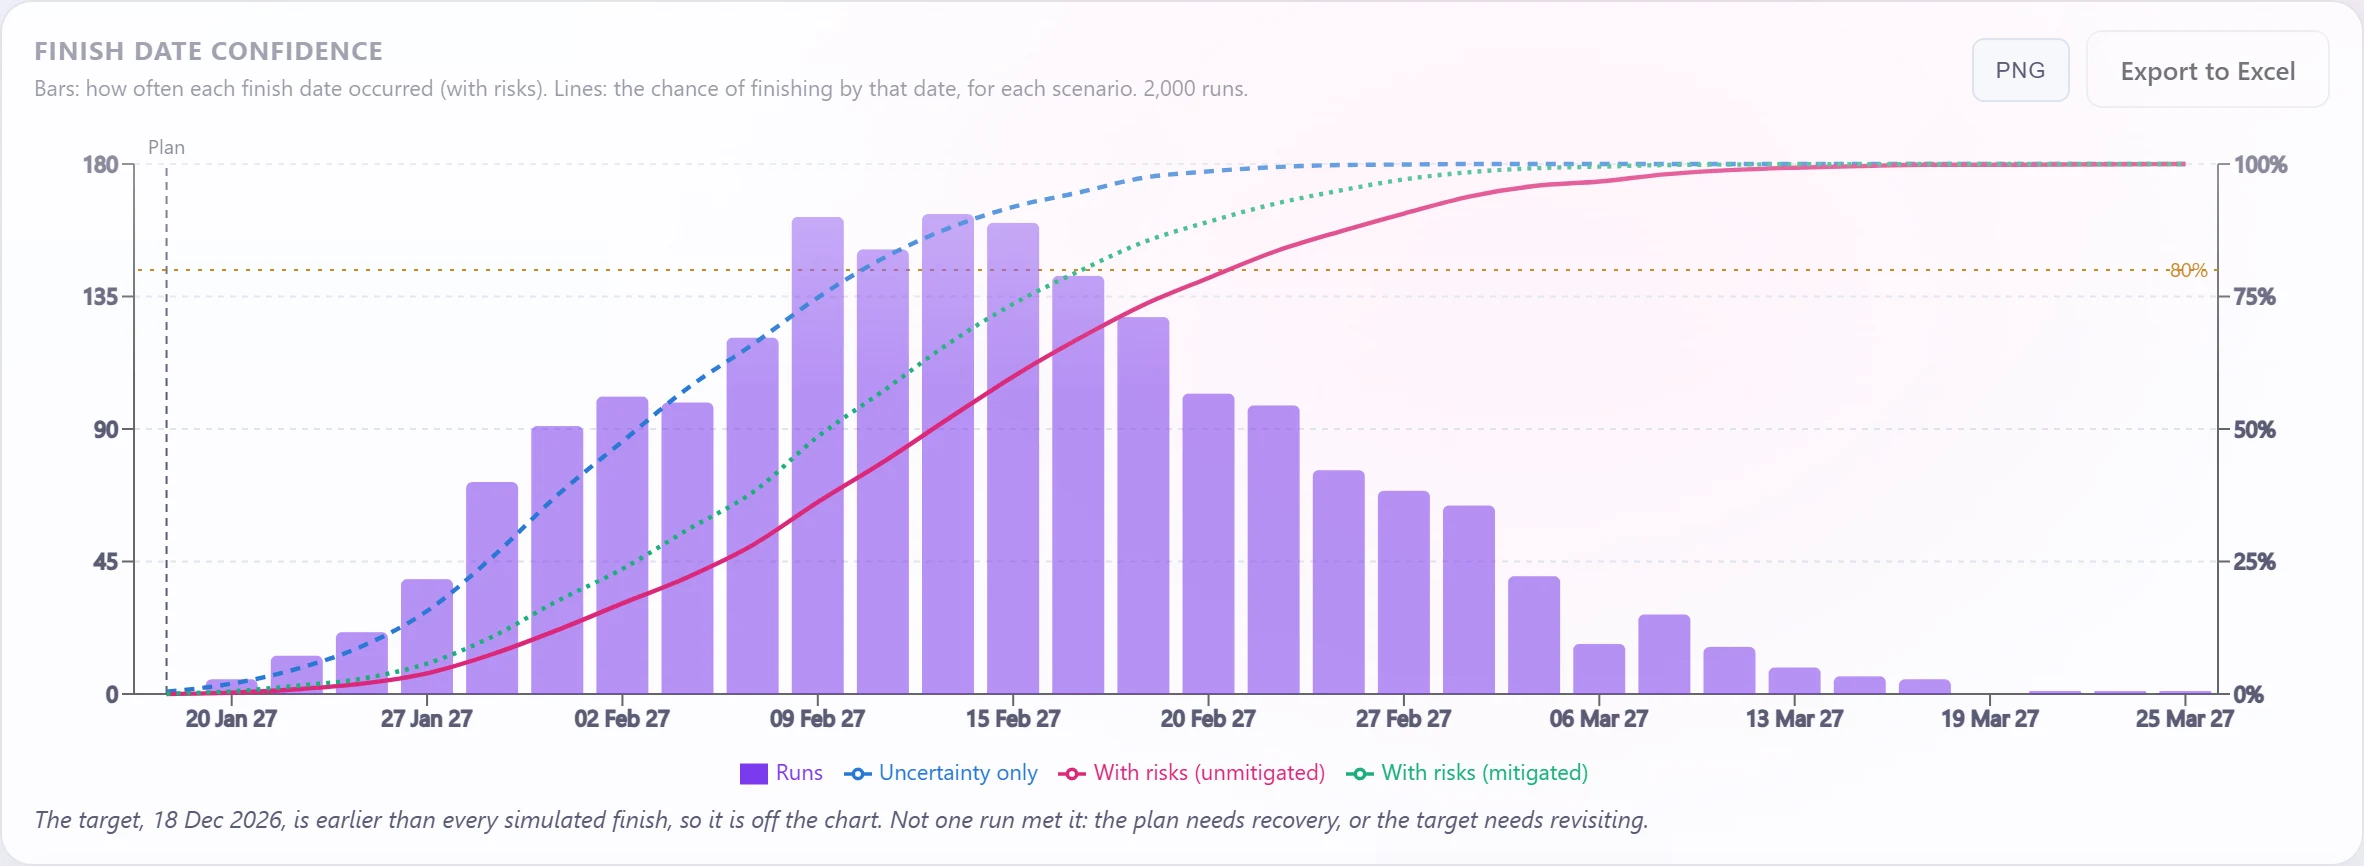
- Finish date confidence: how often each finish date occurred, with the P-dates marked, and the probability of meeting your target date and the planned finish.
- Scenarios: uncertainty only, with risks unmitigated, and with risks mitigated, all on the same random numbers so the difference is the risks and nothing else.
- Risk ranking: each risk's real cost to the finish, measured after float, not its raw impact.
- Milestones: P-dates for every remaining milestone, checked against its deadline constraint.
- Criticality, sensitivity, SSI and cruciality: which activities drive the uncertainty.
- Is the answer stable? A convergence check on the percentiles.
On the demo programme, with 8 risks and the default ranges, there's no chance of meeting the 18 December Completion Date. That's the honest result of a programme already 10 working days late before any risk is applied.
Units#
Impacts are entered in working days, so every gap on the finish is reported in working days on the project calendar, with calendar days alongside. Date-to-date gaps are labelled as calendar days.
How it's checked#
Without sampling, the model reproduces the programme's own finish exactly, and unlinked activities start where P6 scheduled them. The engine is tested against cases with known analytical answers.
Correlation between specific risks, and cost risk, are not modelled yet.