Analysis
Critical path and Gantt
How the critical path is recomputed, stale schedules, and the Gantt.
The app recomputes the critical path from the logic, independently of the float P6 stored in the file. When the two agree, you can trust the stored float. When they don't, the difference is usually where the real problem is.
How it's recomputed#
- A forward and backward pass in real dates, not abstract day numbers.
- Each activity's duration advances on its own calendar, and each lag on its predecessor's calendar, as P6 does. On a programme mixing a 5×8 office week with a 7×12 outage calendar, a day-count pass would mis-rank float badly.
- Completed work is pinned to the dates it actually happened on.
- Work in progress continues from the data date with its remaining duration.
- Constraints that hold early dates back, such as Start On or After, are applied as P6 applies them.
The recomputed dates are checked against P6's own dates on real programmes.
Stale schedules#
If a file wasn't scheduled against its data date, its late dates describe a plan that no longer exists. Every open activity ends up deeply negative, and a plain "float ≤ 0" test marks the whole job critical.
When no activity sits at or above the critical threshold, the app recomputes float from the network and reports criticality from that. The dashboard says which basis it used, and the float chart can show stored and recomputed float side by side.
The Gantt#
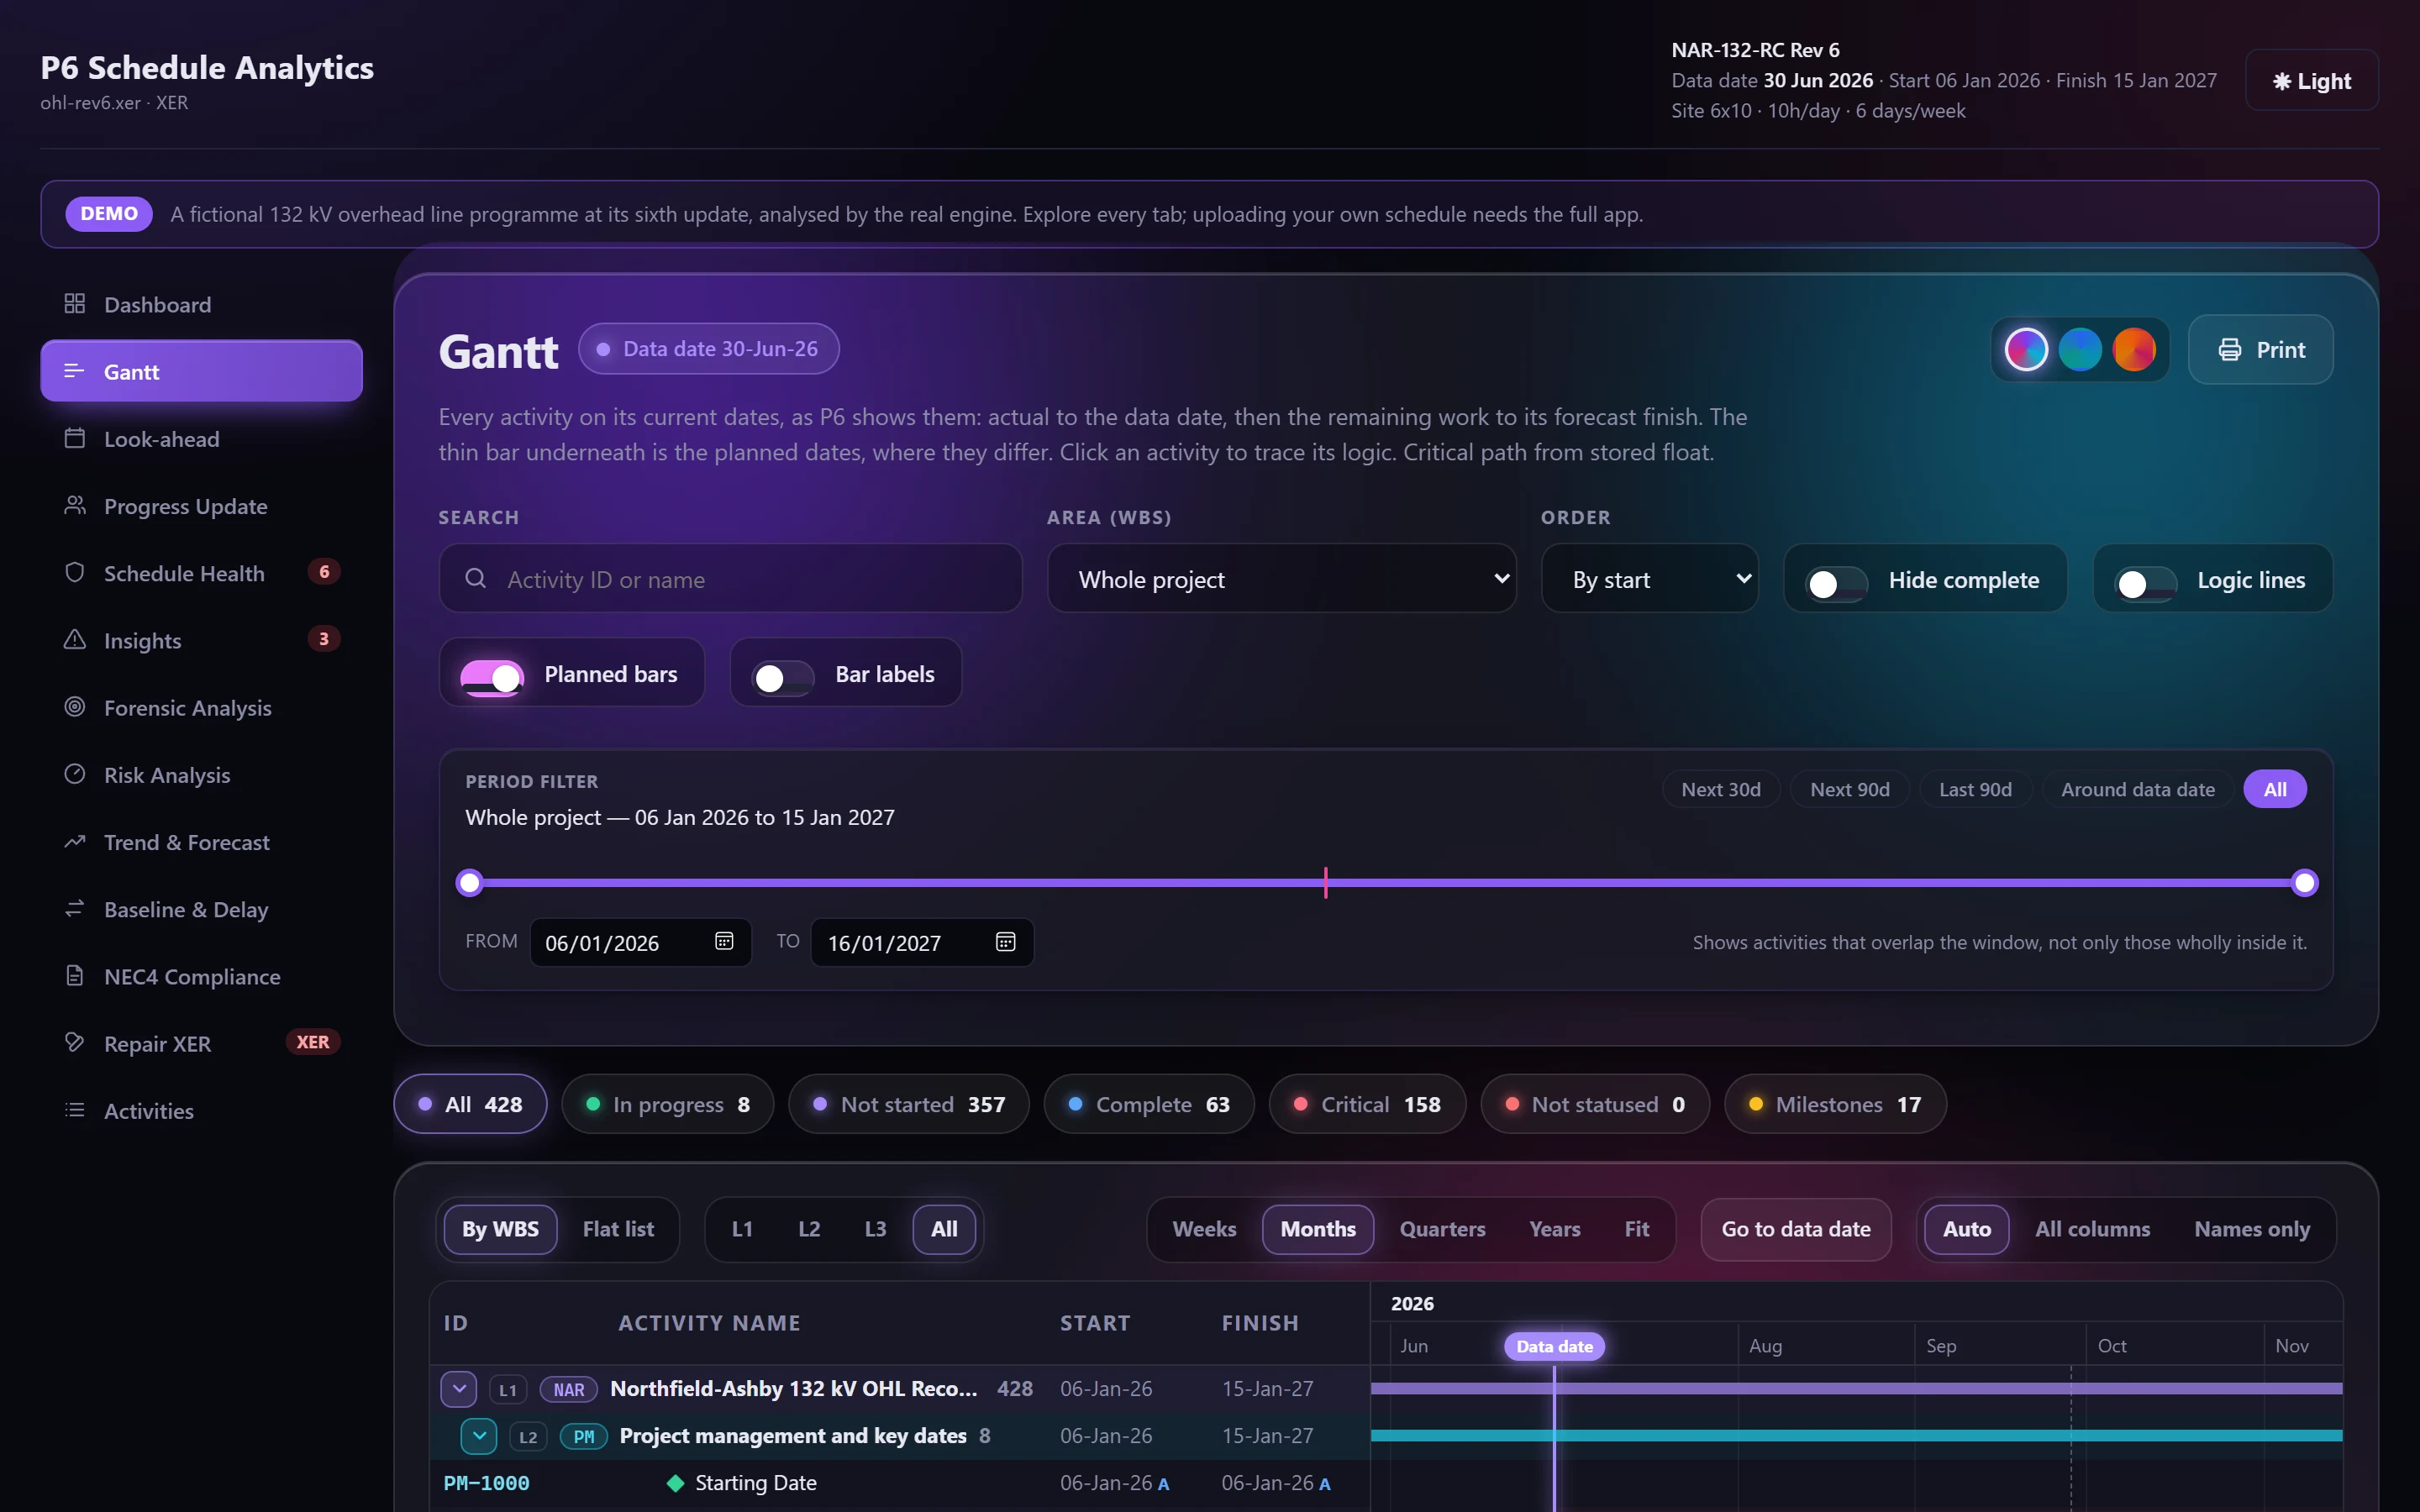
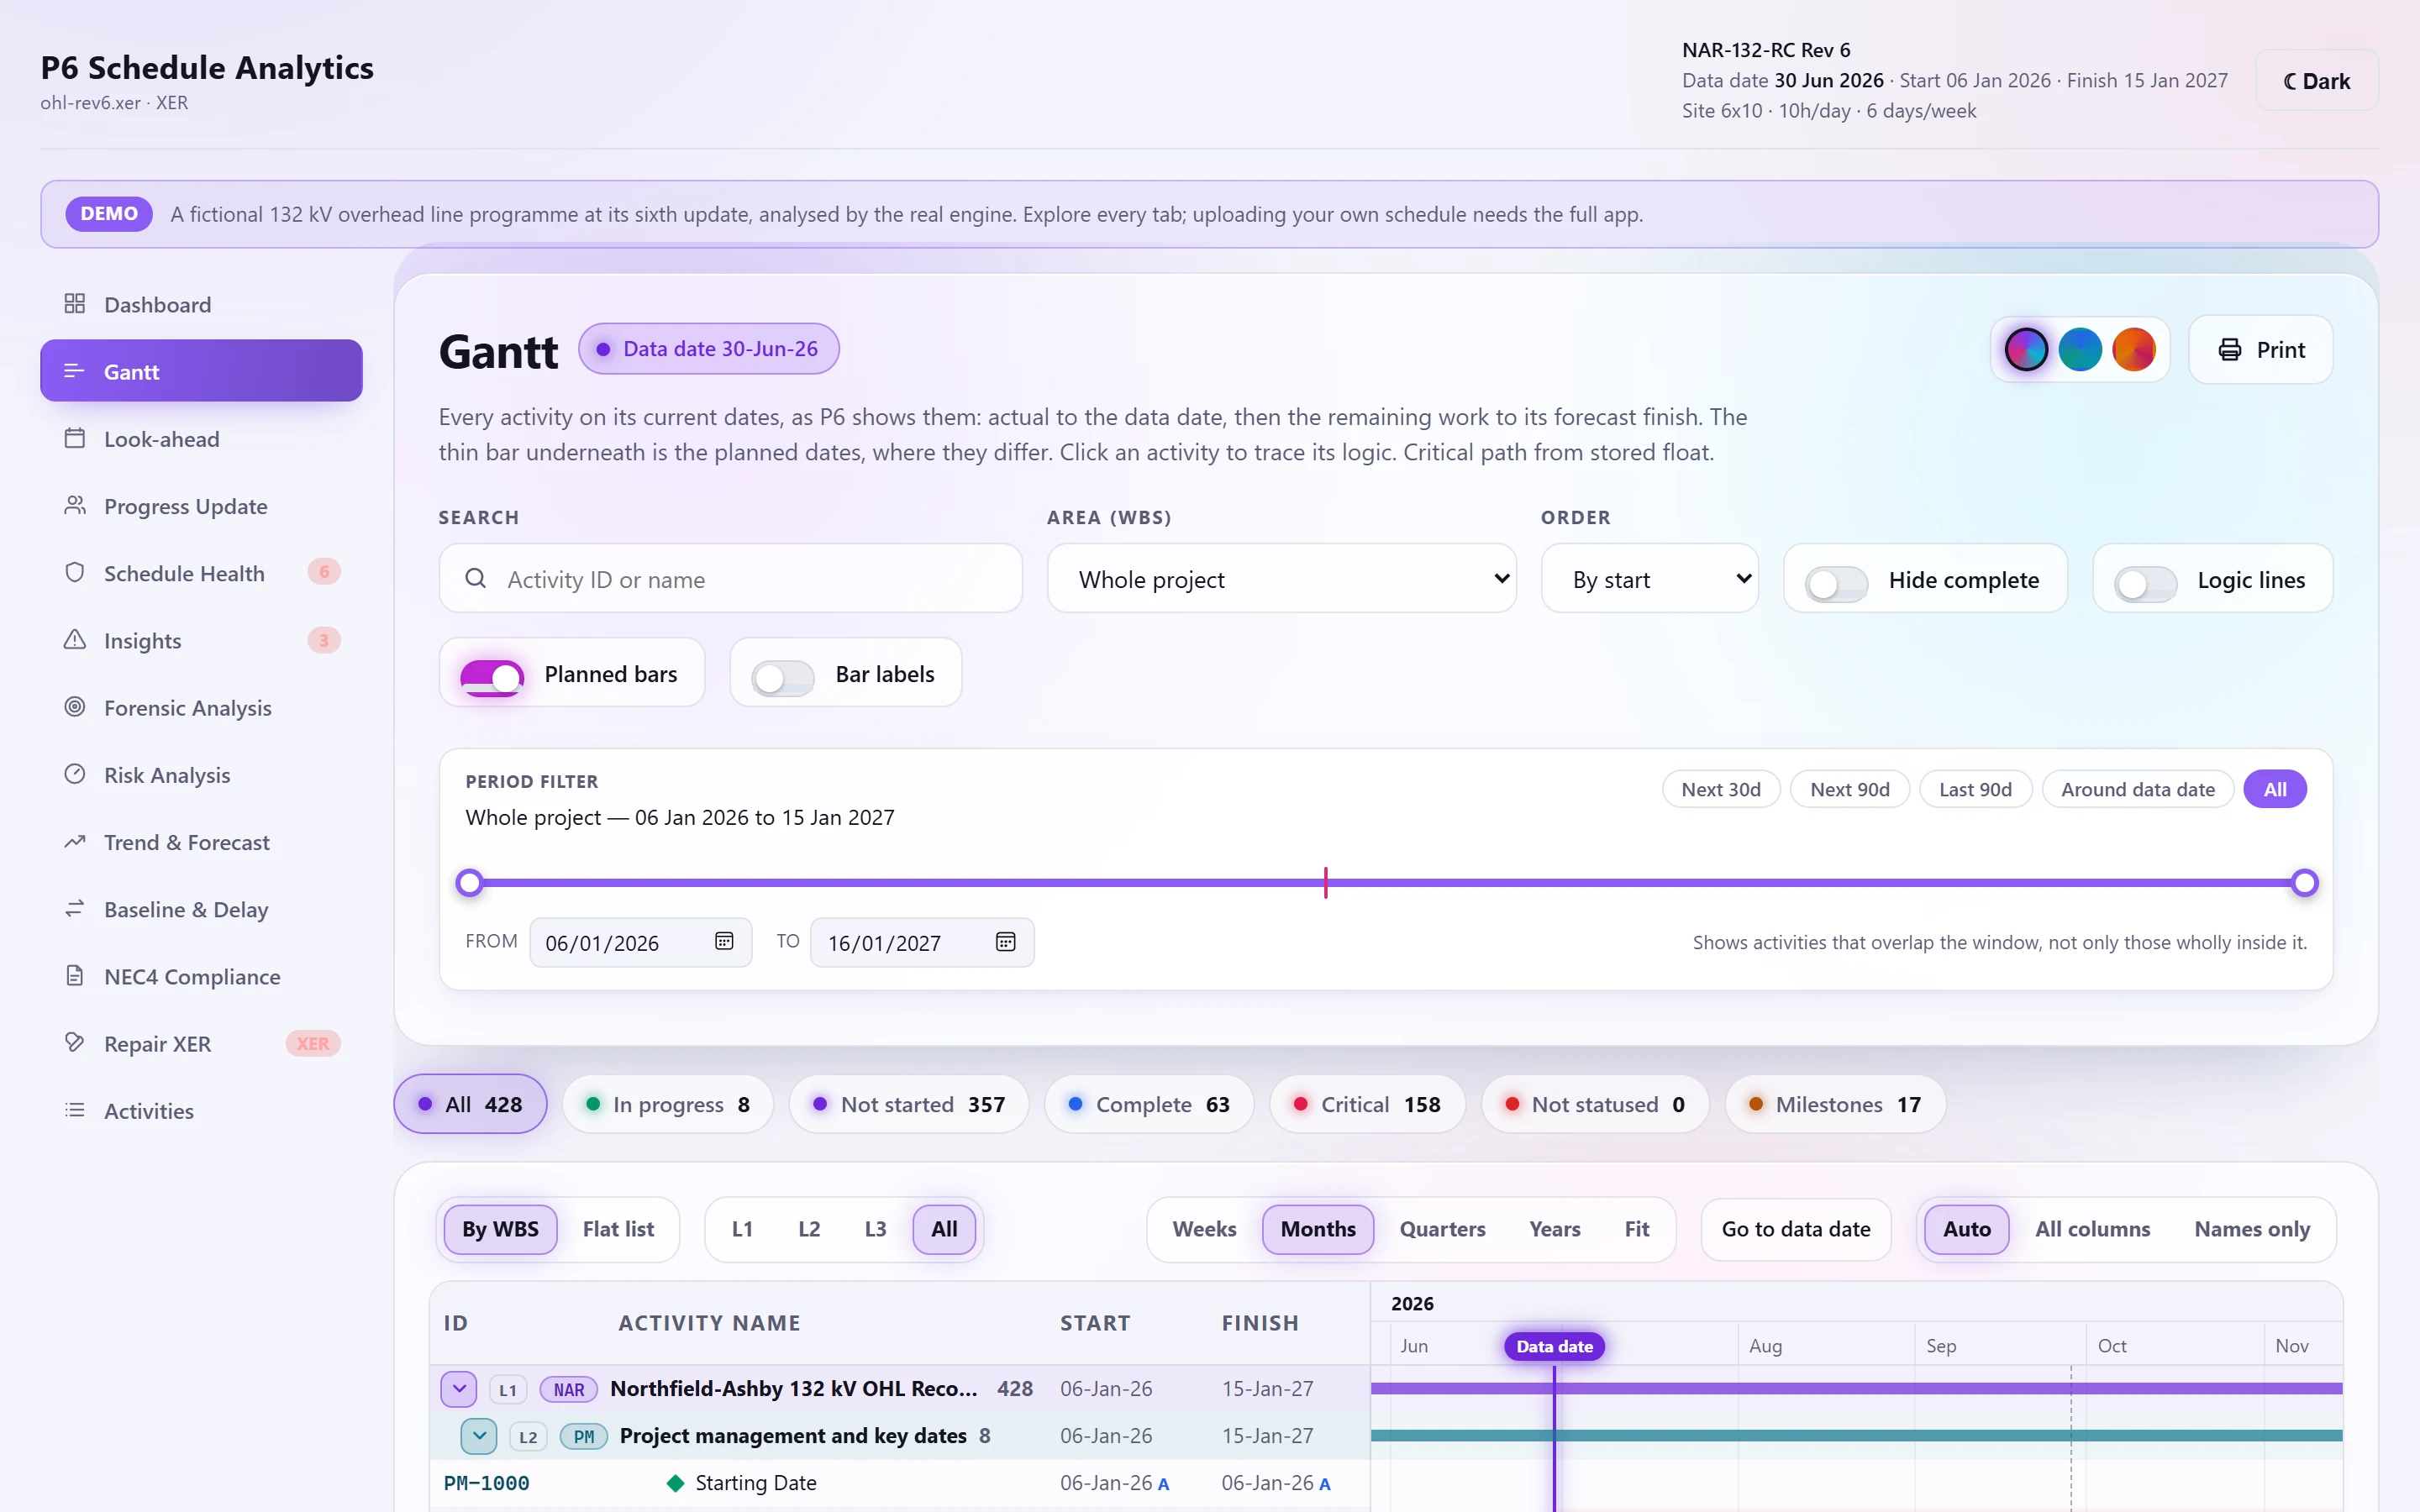
The Gantt draws the whole programme in P6's layout:
- A collapsible WBS tree with summary bars, then ID, name, remaining duration, start, finish and total float, with an A beside actual dates.
- Bars: blue actual to the data date, then green remaining work, red when critical, with the planned dates as a thin bar underneath where they differ.
- Not statused work, whose dates are already past without actuals, is framed.
- Timescale in weeks, months, quarters, years or fit, and a button to go to the data date.
- Filters by text, WBS branch, status, critical, not statused, milestones and period.
- Click an activity to trace its logic: its predecessors and successors are marked and listed, and each jumps to that activity.
Only the rows on screen are drawn, so programmes of thousands of activities scroll smoothly.
Dates the app shows#
Everywhere in the app, an activity's dates are the ones P6 shows in its Start and Finish columns: actual, else early (forecast), else planned. An activity's planned finish is frozen when it starts, so work under way runs to its early finish. Finished work is never shown as critical.
Known limitations#
- Calendar exceptions are applied at day level, not by shift. Advancing a lag on one calendar and retracting it on another can disagree by a day; the tiny negative floats this produces are rounded to zero, and the count is reported on the dashboard.