Analysis
Dashboard and filters
The dashboard, the period filter and the analysis settings.
The dashboard is the first thing you see after an upload: the programme's progress, value, performance and forecast on one page.
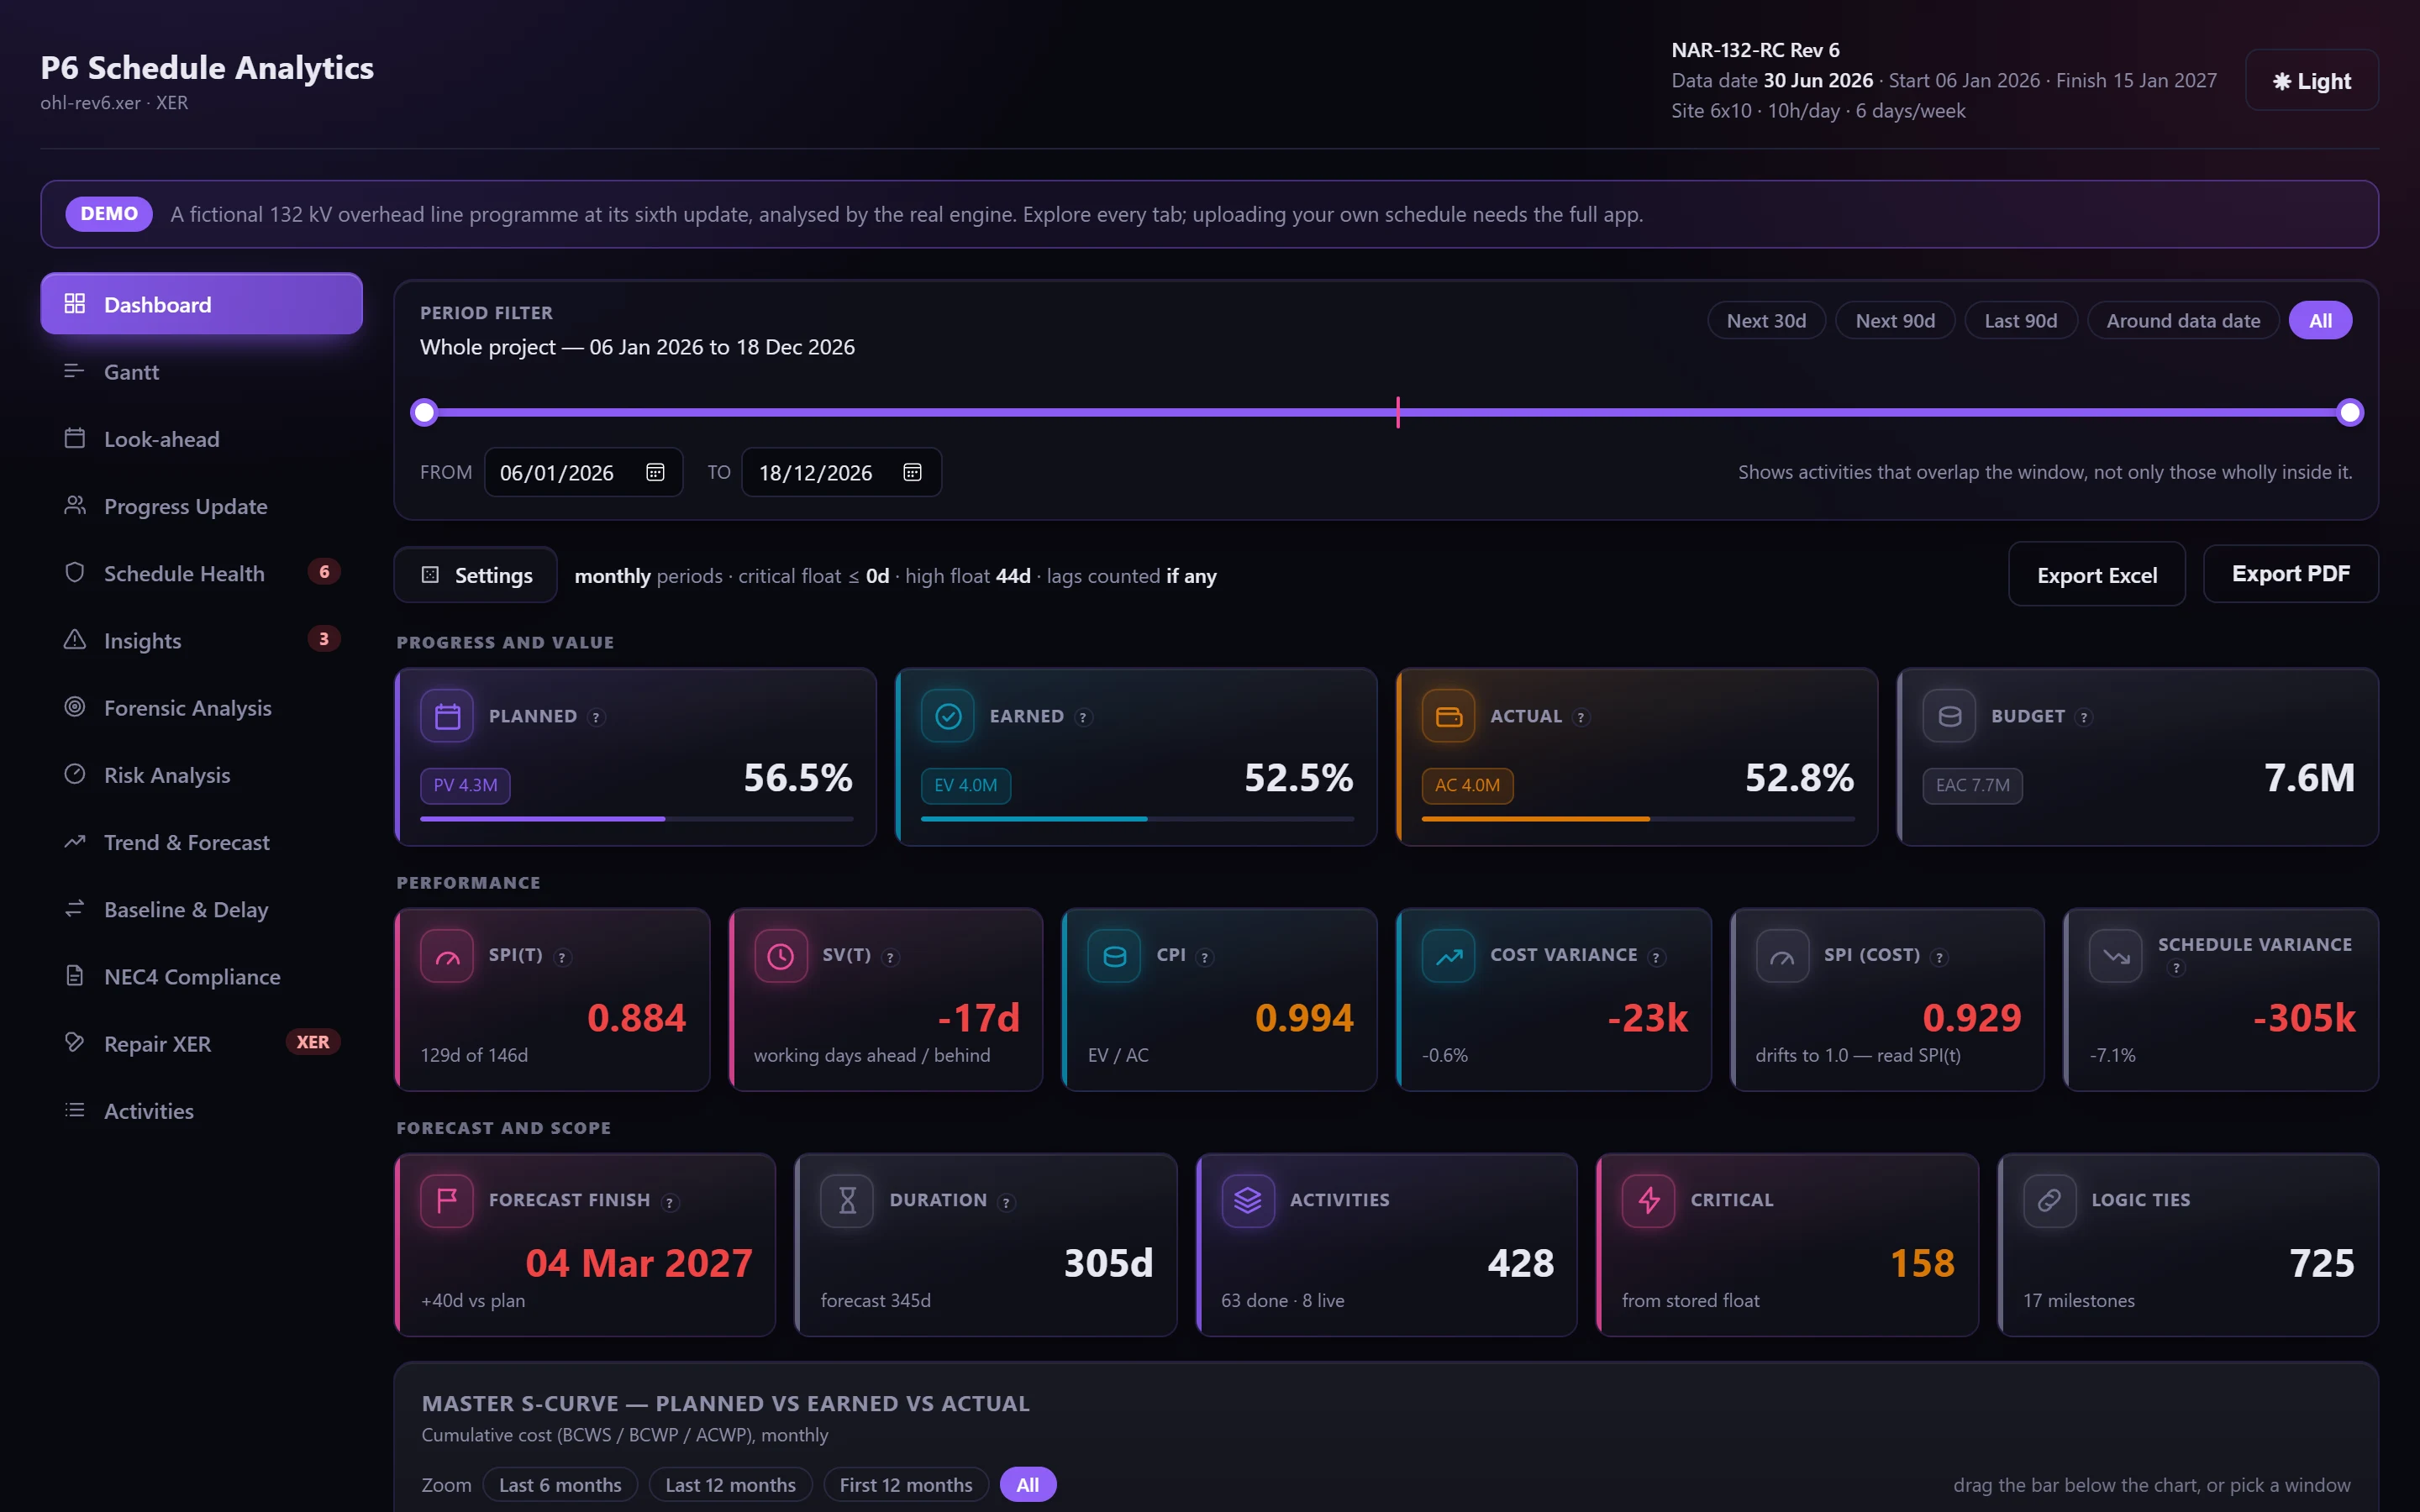
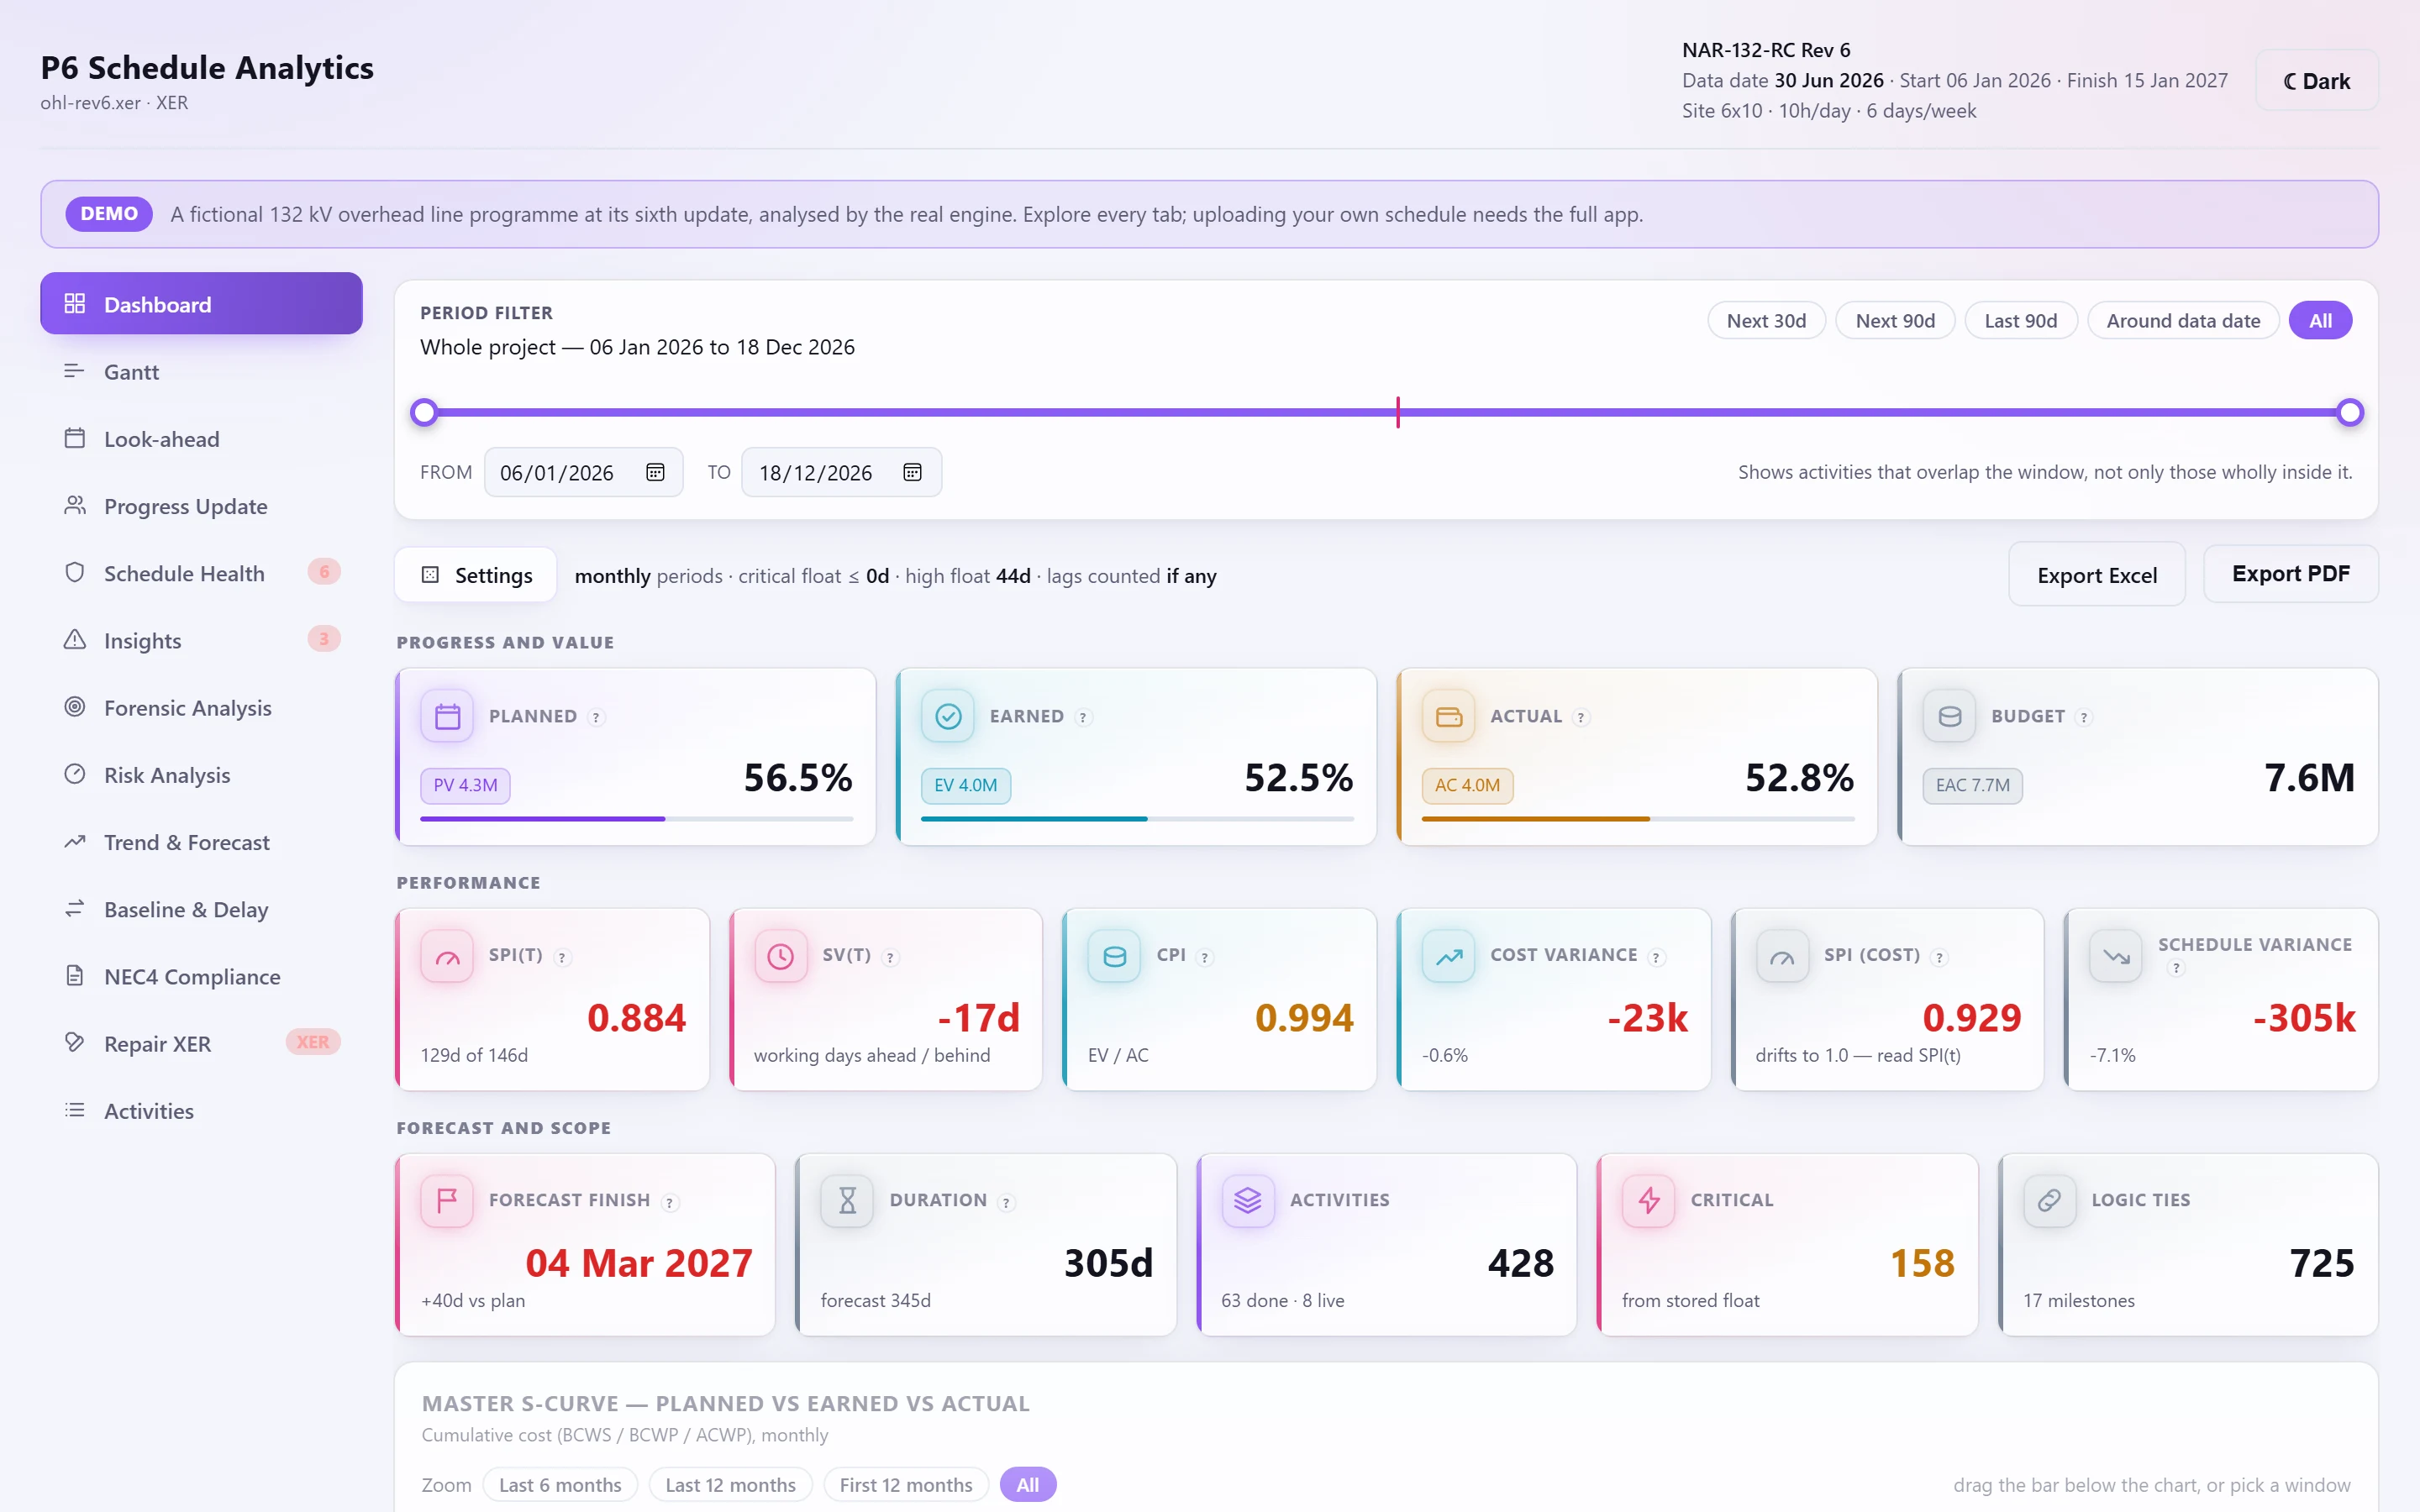
The tiles#
- Progress and value: planned, earned and actual as a share of budget, with PV, EV, AC and the estimate at completion.
- Performance: SPI(t) and SV(t) from Earned Schedule, CPI and cost variance, SPI and schedule variance from cost. Each has a ? that explains it.
- Forecast and scope: the Earned Schedule forecast finish, the planned and forecast duration, activity counts, critical activities and logic ties.
See Earned value and earned schedule for what each figure means.
The charts#
- Master S-curve: planned, earned and actual value, cumulative, by day, week or month. Zoom to the last 6 or 12 months, the first 12, or drag the bar under the chart.
- Total float distribution: open activities in float bands from below zero to over 40 days. Where the critical path was recomputed, stored and recomputed float can be shown side by side.
- Status mix and critical vs non-critical work.
- Resources: demand over time stacked by resource type or by resource, demand share, planned against actual totals, and over-allocation where a resource has a maximum.
- Driving path: the activities on the recomputed path to completion.
Every chart can be saved as a PNG from its corner.
The period filter#
The filter above the dashboard narrows it to a date window: the next 30 or 90 days, the last 90, around the data date, or dates you choose. It keeps activities that overlap the window, not only those wholly inside it, and uses the dates P6 shows now: actual, else forecast, else planned. So live work is never dropped from a period it's still running in.
Analysis settings#
The settings strip sets:
| Setting | Default | Used by |
|---|---|---|
| Period | Monthly | S-curves and histograms |
| Critical float | 0 days | What counts as critical |
| High float | 44 days | DCMA check 6 |
| High duration | 44 days | DCMA check 8 |
| Lag threshold | 0 (any positive lag) | DCMA check 3 |
An administrator sets the defaults for everyone under Administration → Analysis defaults.
Diagnostics#
Findings about the data itself appear above everything else, because they change how the rest should be read:
- the file wasn't rescheduled against its data date;
- all stored float is negative, so the critical path was recomputed from the logic;
- cost was taken from resource assignments because the activity cost fields were empty;
- the file carries no cost, so curves are in resource units;
- activities without late dates, left out of float-based checks.