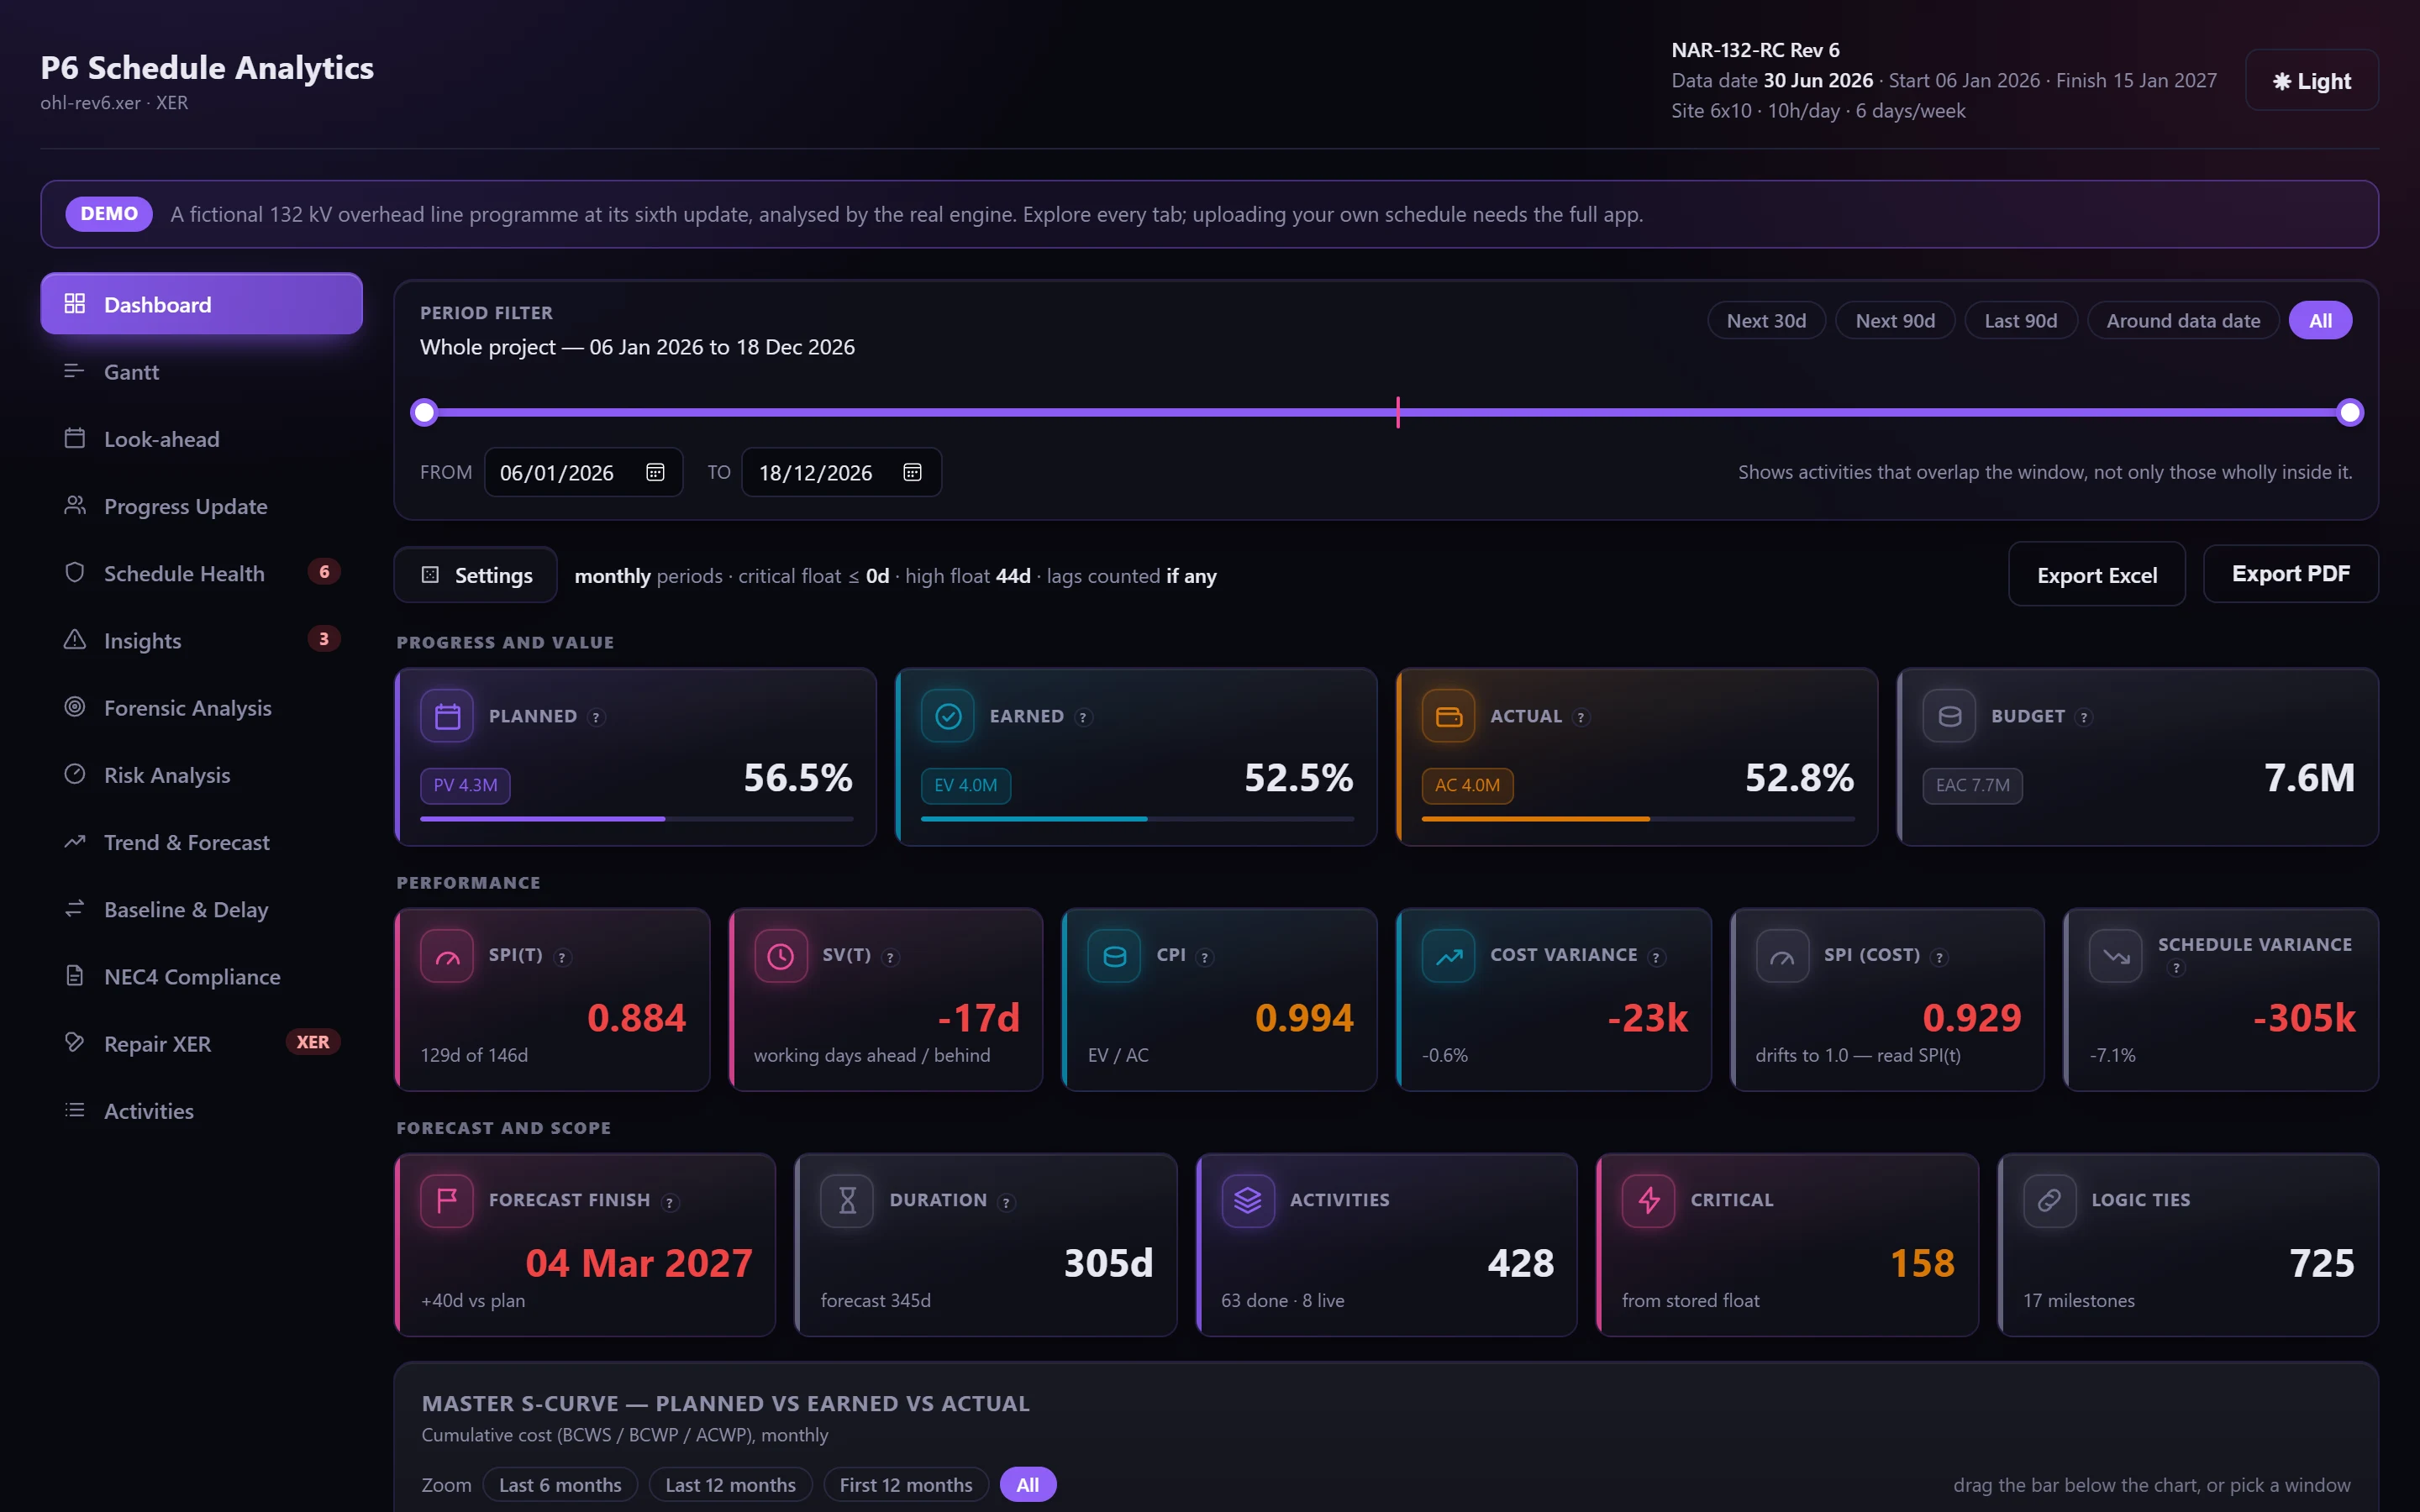
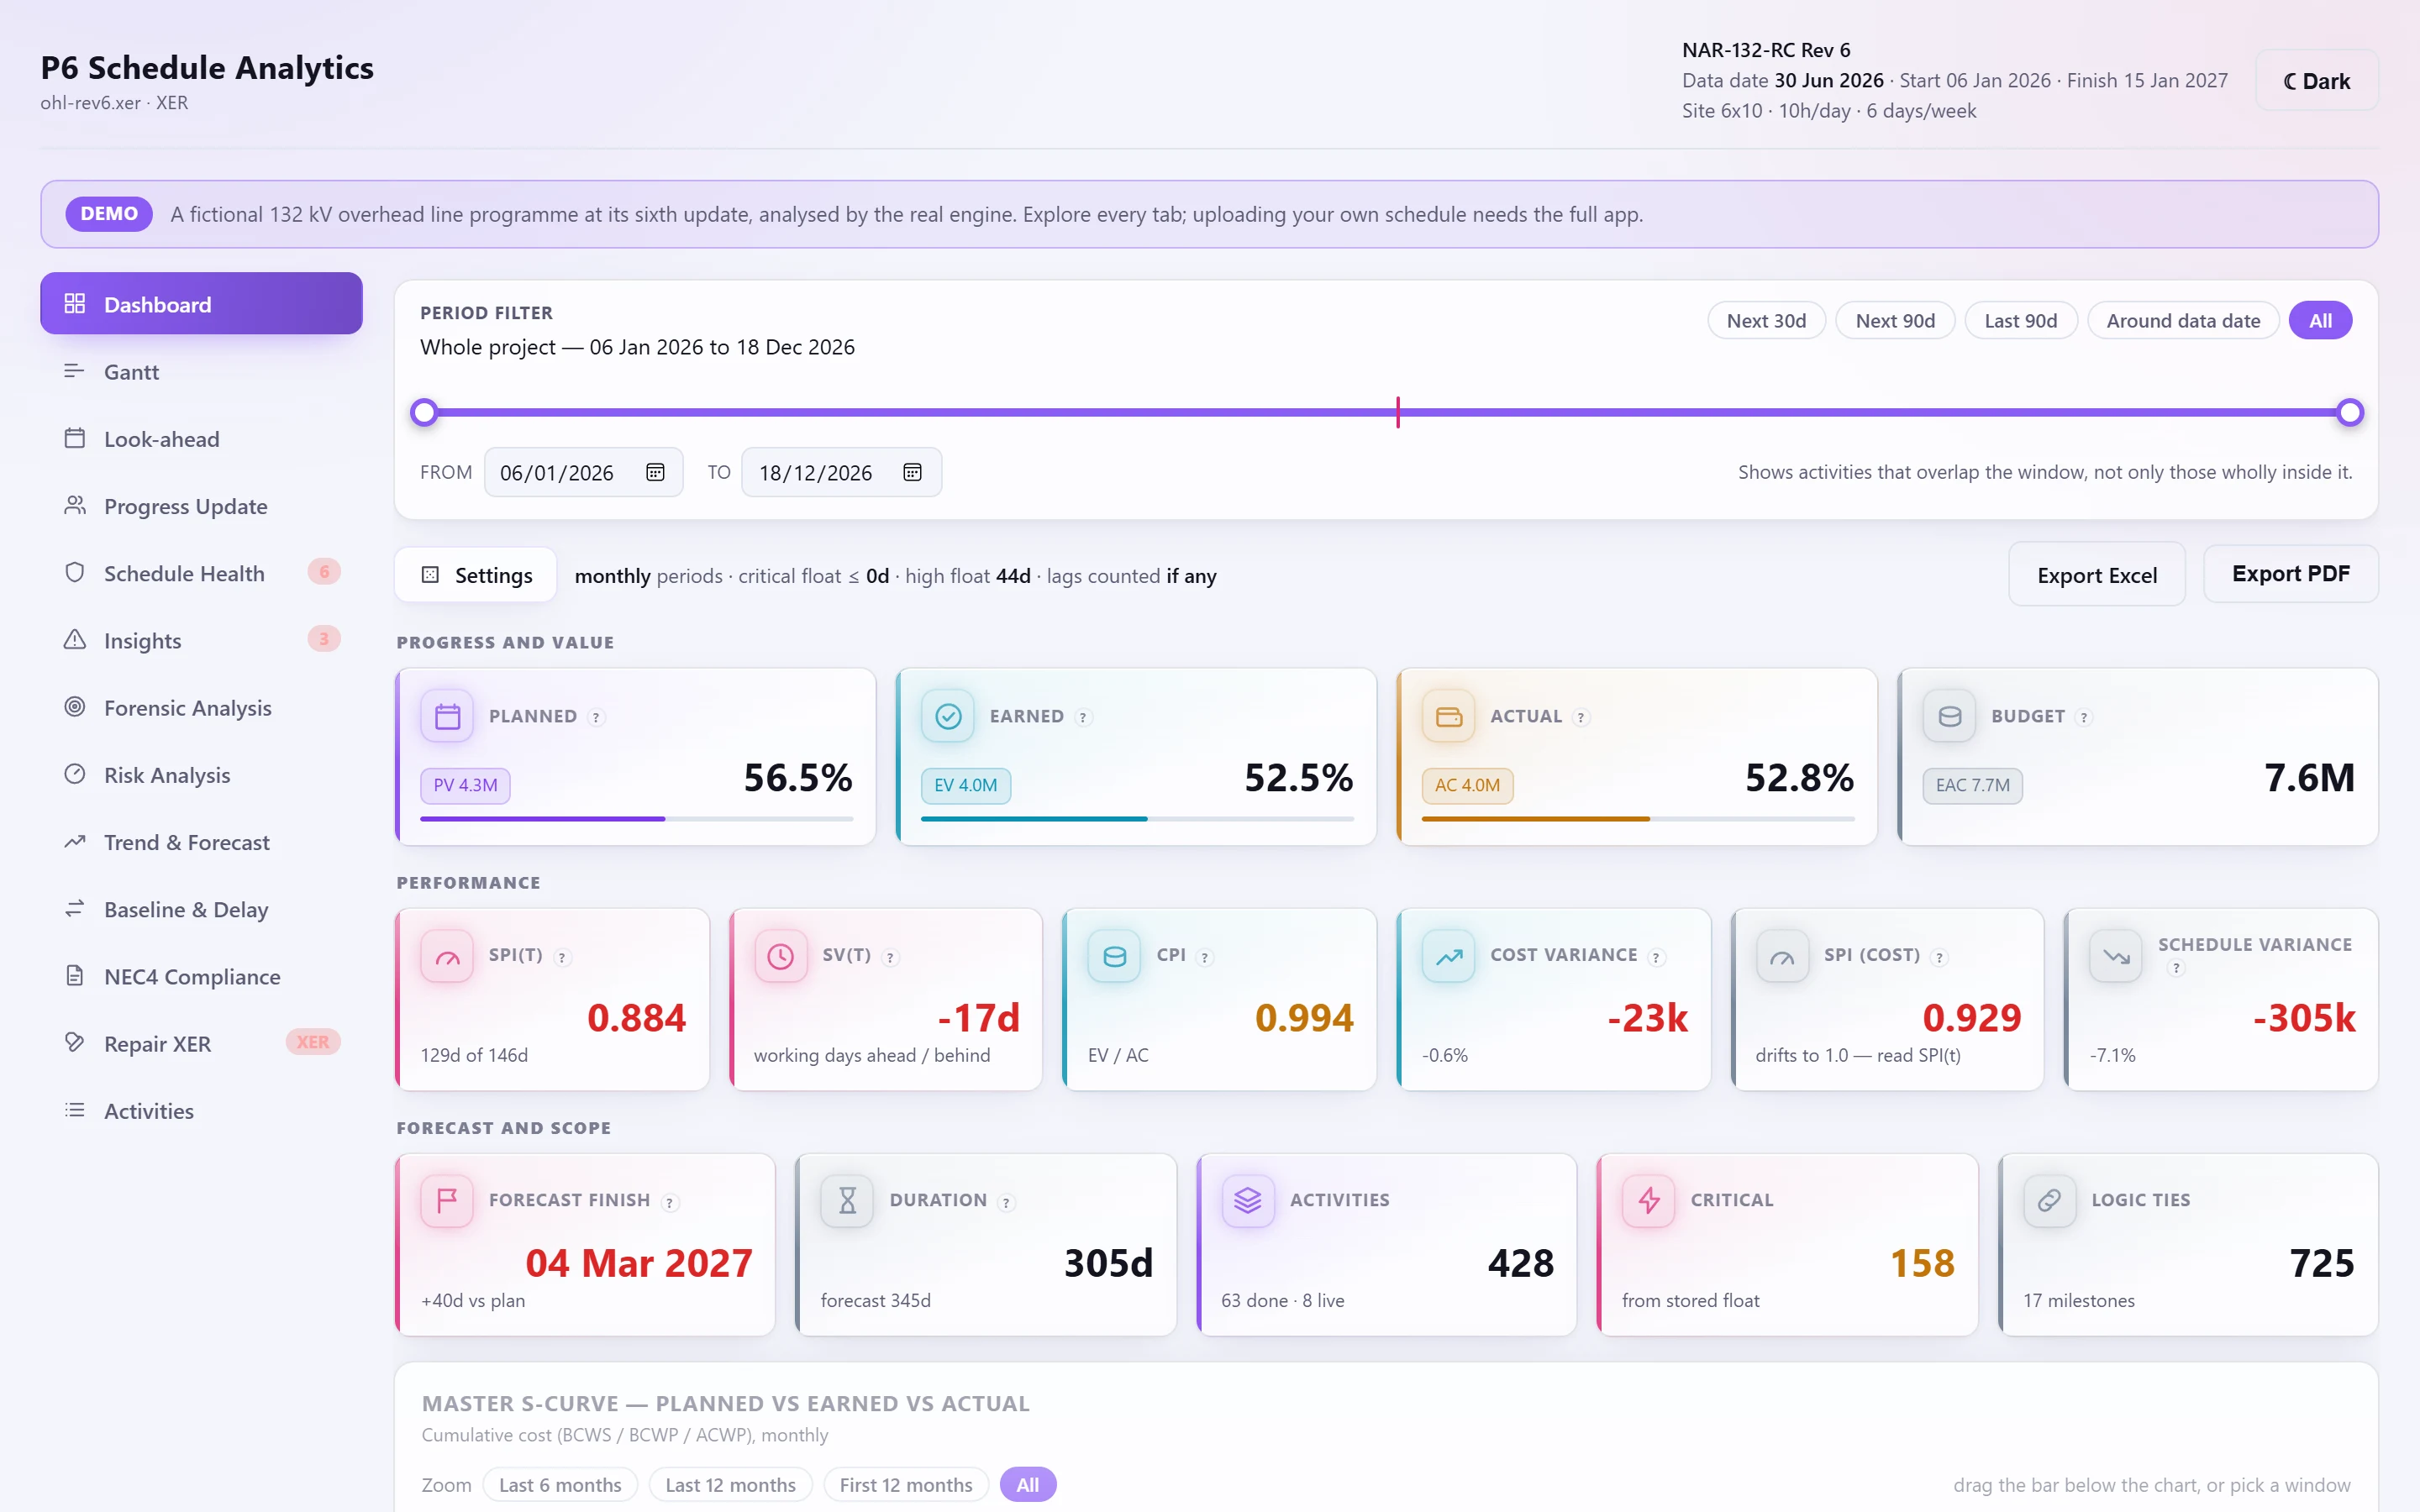
PV, EV and AC spread across each activity's own working calendar, then SPI, CPI, EAC, TCPI and the rest. Earned Schedule gives SPI(t) and a forecast finish that stays honest late in the job, when cost-based SPI drifts back to 1.0.
What it gives you
S-curves at daily, weekly or monthly grain, cumulative and per period, split critical and non-critical.
Cost is read from resource assignments when the activity cost fields are empty, and the dashboard says which basis it used.
Earned Schedule turns progress into a working-day variance and a forecast finish date.
Read the way P6 stores it
- Durations, lags and float are stored in hours; they're converted with each activity's own hours per day.
- When the nominated percent-complete type is empty, the engine falls back through physical, units and duration percent.
- With no cost in the file at all, curves and indices are shown in resource units, and labelled as such.
Measured against the programme's planned dates
Planned value is spread across each activity's planned (target) dates as the export stores them. When the export doesn't carry a separate baseline, those planned dates are the baseline, and the app states it.
| Metric | Formula |
|---|---|
| BAC | Σ activity budget (assignment cost, else activity cost; units if no cost) |
| PV (BCWS) | Budget × working days elapsed of the planned span, on the activity's calendar |
| EV (BCWP) | Σ budget × % complete |
| AC (ACWP) | Σ actual cost |
| SV · CV | EV − PV · EV − AC |
| SPI · CPI | EV ÷ PV · EV ÷ AC |
| EAC · VAC | BAC ÷ CPI · BAC − EAC |
| TCPI | (BAC − EV) ÷ (BAC − AC) |
| ES | The date on the planned curve where today's EV would have been earned |
| SPI(t) · SV(t) | ES ÷ AT · ES − AT, in working days |
| IEAC(t) | Planned duration ÷ SPI(t), giving a forecast finish date |
Check your next update before anyone else does.
Fourteen days free. Export an XER from P6 and see what it says.